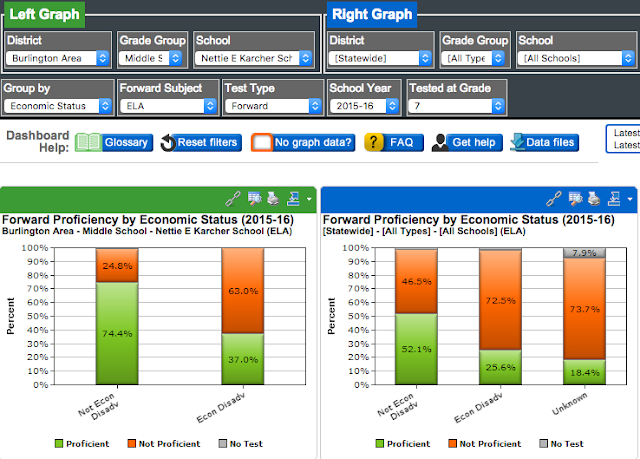
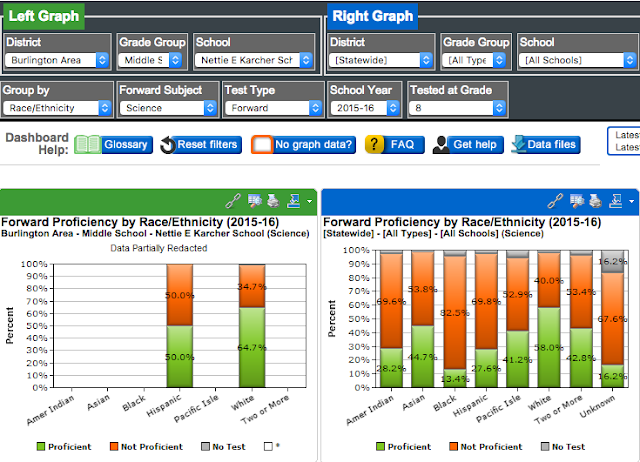
Staff... below is an array of screen shots from WISEdash breaking down our Forward Exam Data.
- I pulled information for all tests given in both grade levels:
- 7th grade - ELA and math
- 8th grade - ELA, math, science, and social studies.
- I pulled data to see comparisons to our neighboring schools:
- Waterford, Union Grove, Lake Geneva, and Elkhorn.
- I pulled based on SES, Gender, and race as well within our own building.
- I pulled to separate students with disabilities versus students without disabilities.
- As you look at each one please note at the top which is which. Burlington's data is always the graphs on the left, with either the state average or district comparisons on the right.
- Please take a look at this data during your Team Time.
Comparing to the state average...
Comparing to neighboring school districts...
Comparison to the state regarding economically disadvantaged vs non-economically disadvantaged students:
Our special education students vs our non-special education students in comparison to the state average.
Comparison to the state based on gender.
Comparison to the state based on race/ethnicity.
What is TRULY impressive is when comparing to high flying school districts WE, Karcher Middle School, out performed EVERY SINGLE ONE OF THEM in the area of 8th grade ELA!!!!!!!!!!!
You are all the reason for that and should be so extremely proud of the work you did last year - it made an impact on our students! Your collective efficacy plays a huge role as well as you all truly believe students can learn and achieve their goals! Now... hold our high expectations for literacy integration across all disciplines and continue to push ourselves to close our own personal achievement gaps :)


